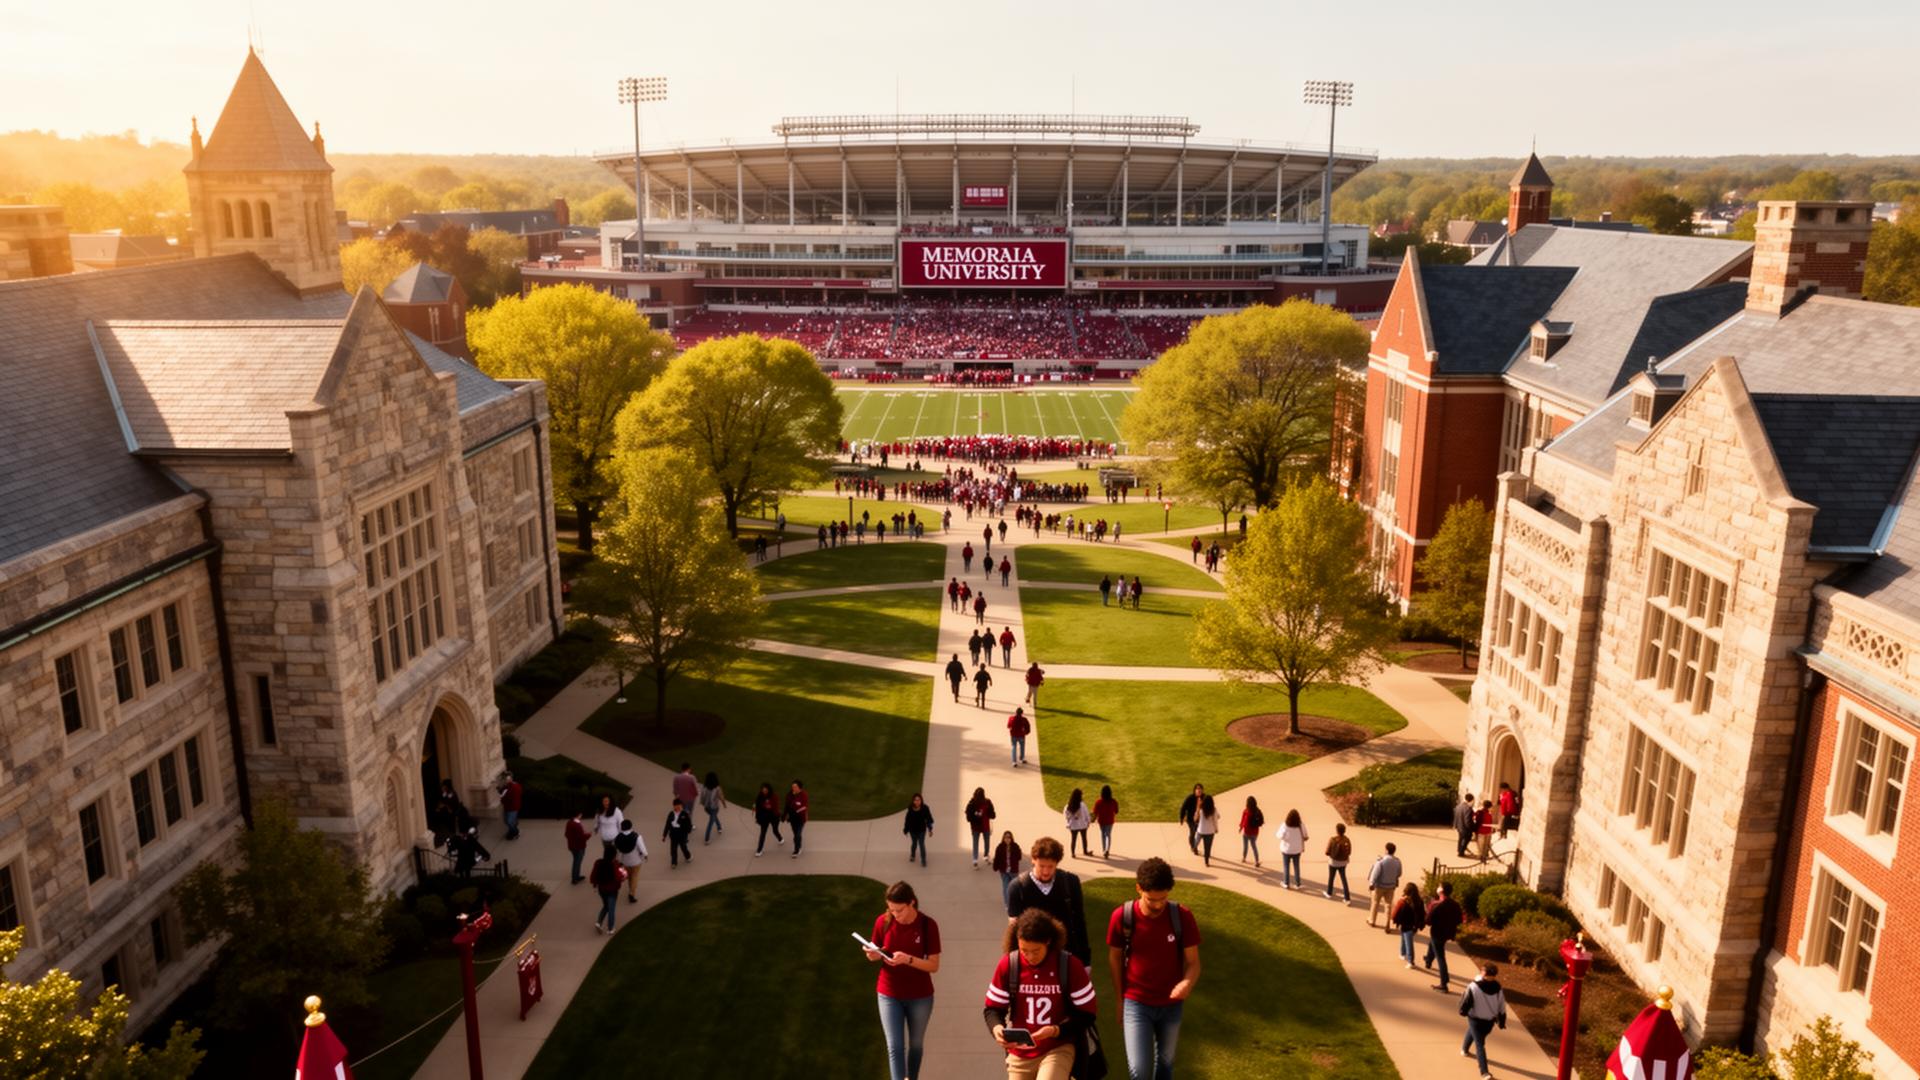
Indiana University campus
Demonstration-only · Partner Simulation

Imagine Every Student Becoming Part of Campus Awareness

Supporting safer events, faster responses, improved fan experiences, and a more connected university community.

Simulated Deployment Scope
Students
Faculty
Residence Halls
Athletics
Transportation
Graduation Events
Visitor Experience
Campus Safety
The Simulated AI Podcast

Indiana Game Day Intelligence — Tune In

Click the cover below to play a simulated conversation on campus safety, fan experience, and game day intelligence powered by community contributions.

The Modern University Challenge

The Challenge Facing Modern Universities

Today's campuses face hundreds of small incidents every week — most of them never reach the people who could respond.

Crowd disturbances
Concerts, rallies, tailgates
Student altercations
Residence halls and venues
Medical emergencies
On-campus, slow detection
Residence hall incidents
Water leaks, damage, noise
Parking conflicts
Event days, peak hours
Tailgate issues
Pre/post-game safety
Property damage
Reported days later
Suspicious activity
Often unreported
Delayed reporting
Hours-to-days lag
Why Incidents Go Unreported
~73%

Of students surveyed across U.S. campuses say they hesitate to report incidents because they don't know who to contact or believe reporting is too difficult.

Illustrative figure for simulation
Today's Reporting Cycle
1
Issue happens
2
Student unsure what to do
3
Incident escalates
4
University learns later
5
Poor student experience
Introducing CivilCamAi

A Three-Step Community Intelligence Platform

Step 1

Campus Geofencing™

A digital boundary is drawn around every campus zone so submissions are validated by location, not just identity.

Football stadium
Basketball arena
Residence halls
Academic buildings
Parking lots
Student union
Transportation hubs
Tailgate fields
Step 2

QR Code Access

Students scan and immediately enter CivilCamAi. No accounts. No forms. No friction.
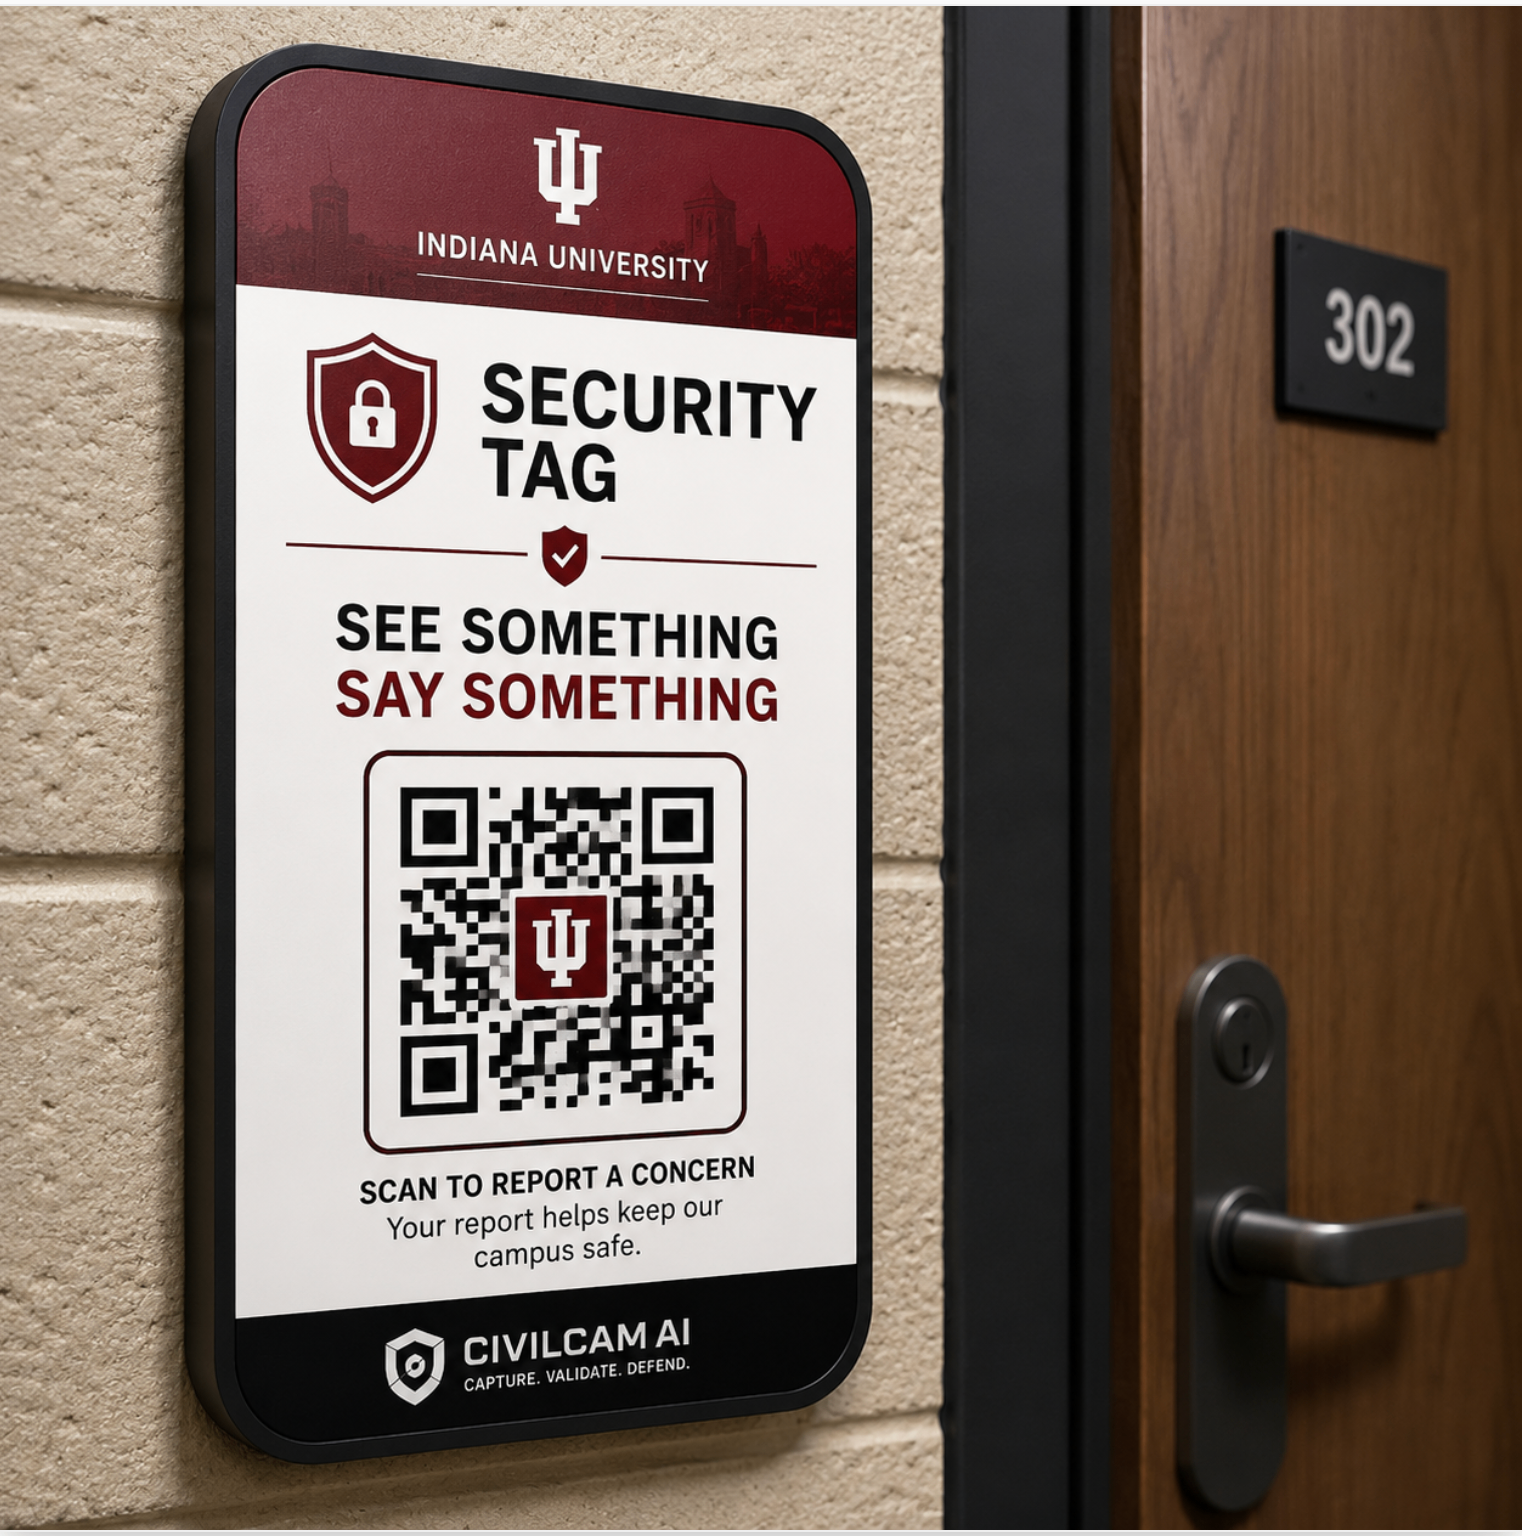
IU Security Tag with QR code mounted on a wall near a residence hall door for easy access
Placed in high-traffic areas so anyone can scan and report — no app install required
Student ID cards
Event signage
Residence halls
Shuttle buses
Stadium scoreboards
Step 3

Real-Time Intelligence

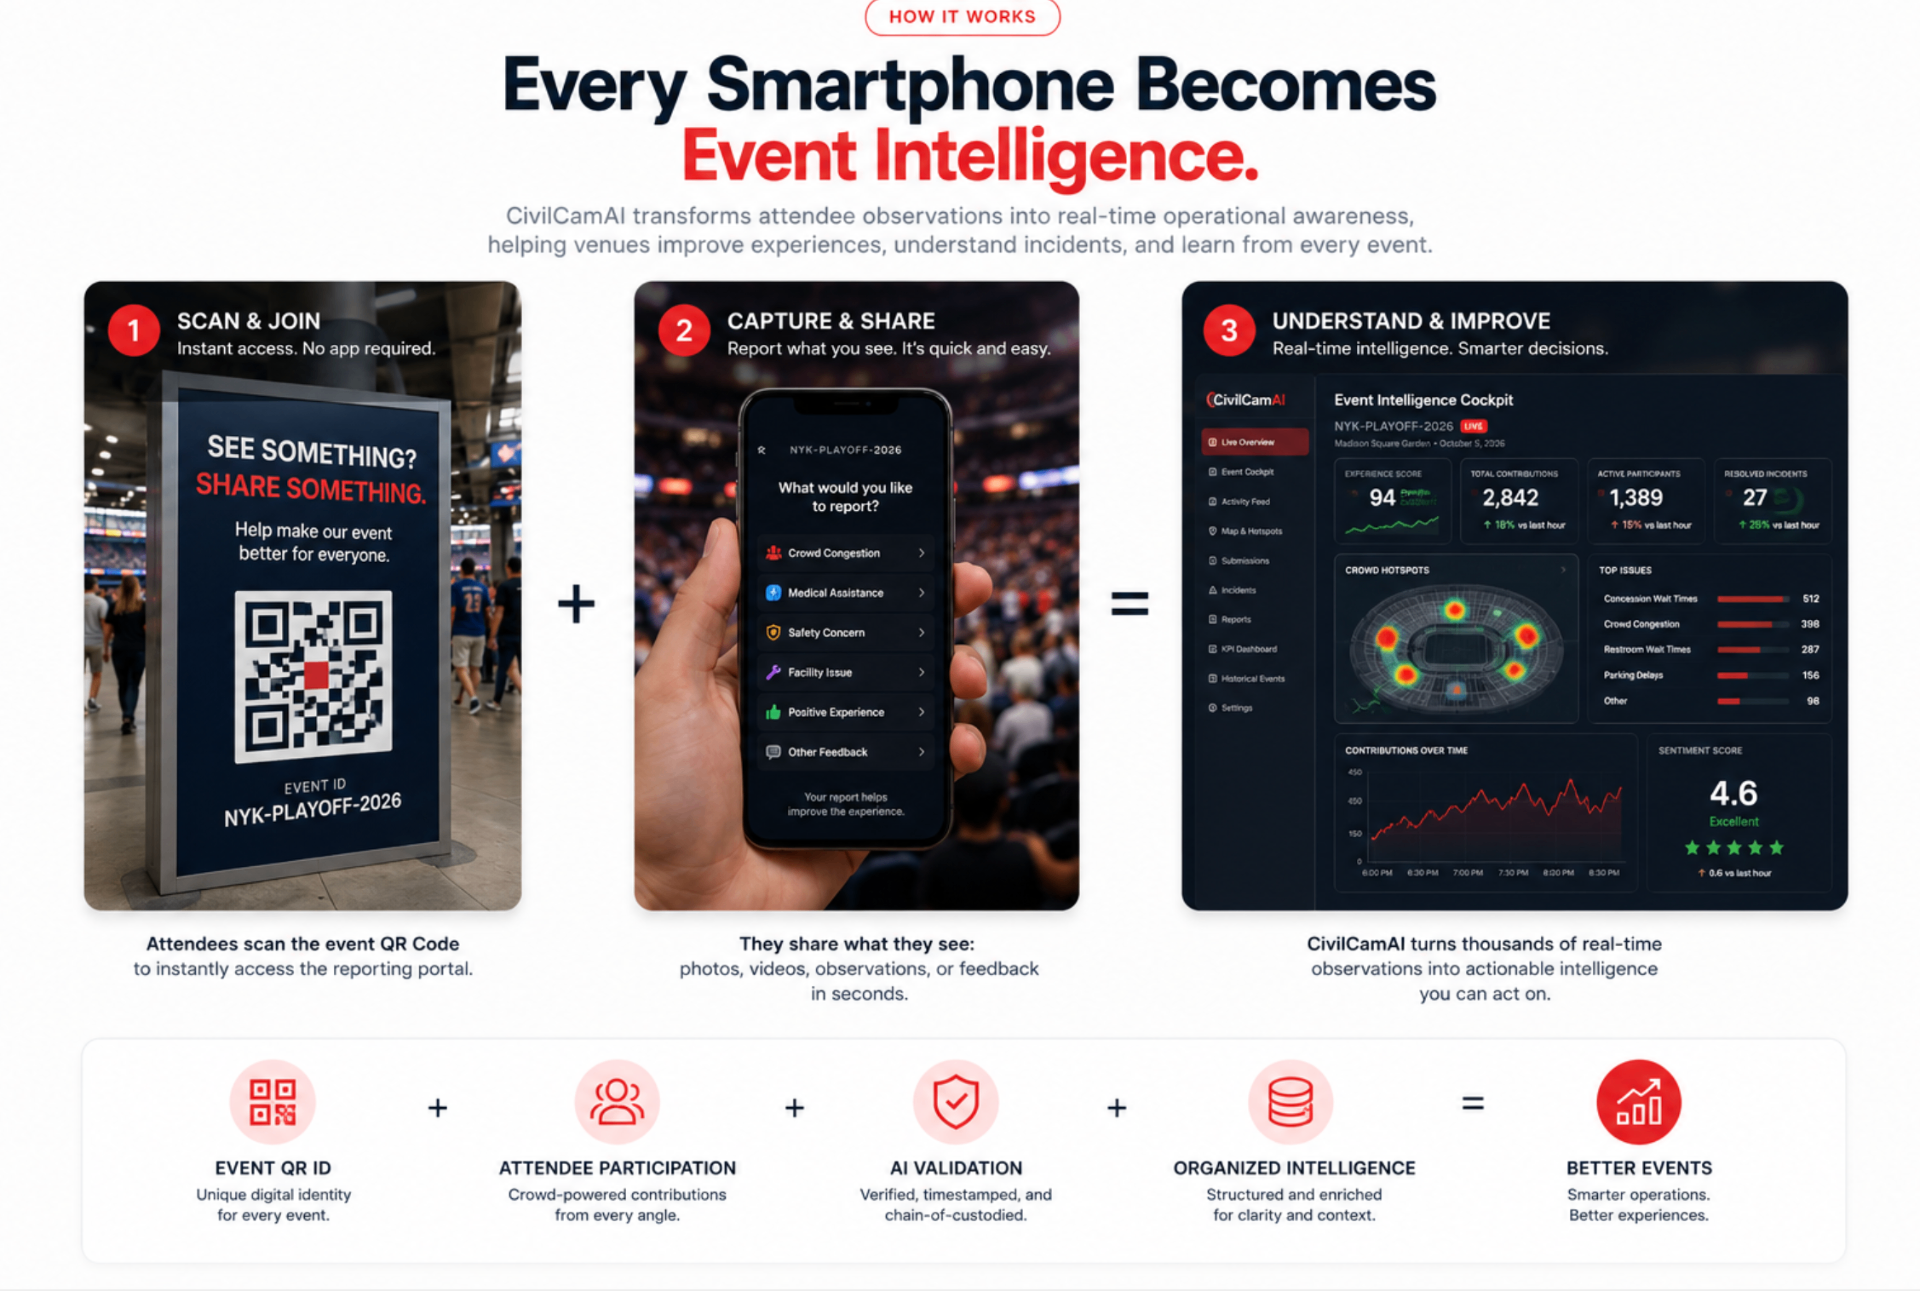
Validated submissions flow into the Indiana University Command Center™ in real time.
Photoslive
Videoslive
Voice reportslive
Text observationslive
Location datalive
How CivilCamAI works: attendees scan an event QR code to join, capture and share what they see, and CivilCamAI turns real-time observations into actionable event intelligence
The Intelligence Loop

A More Connected Campus

From student observations to validated intelligence — how CivilCamAi transforms everyday campus activity into actionable insight.
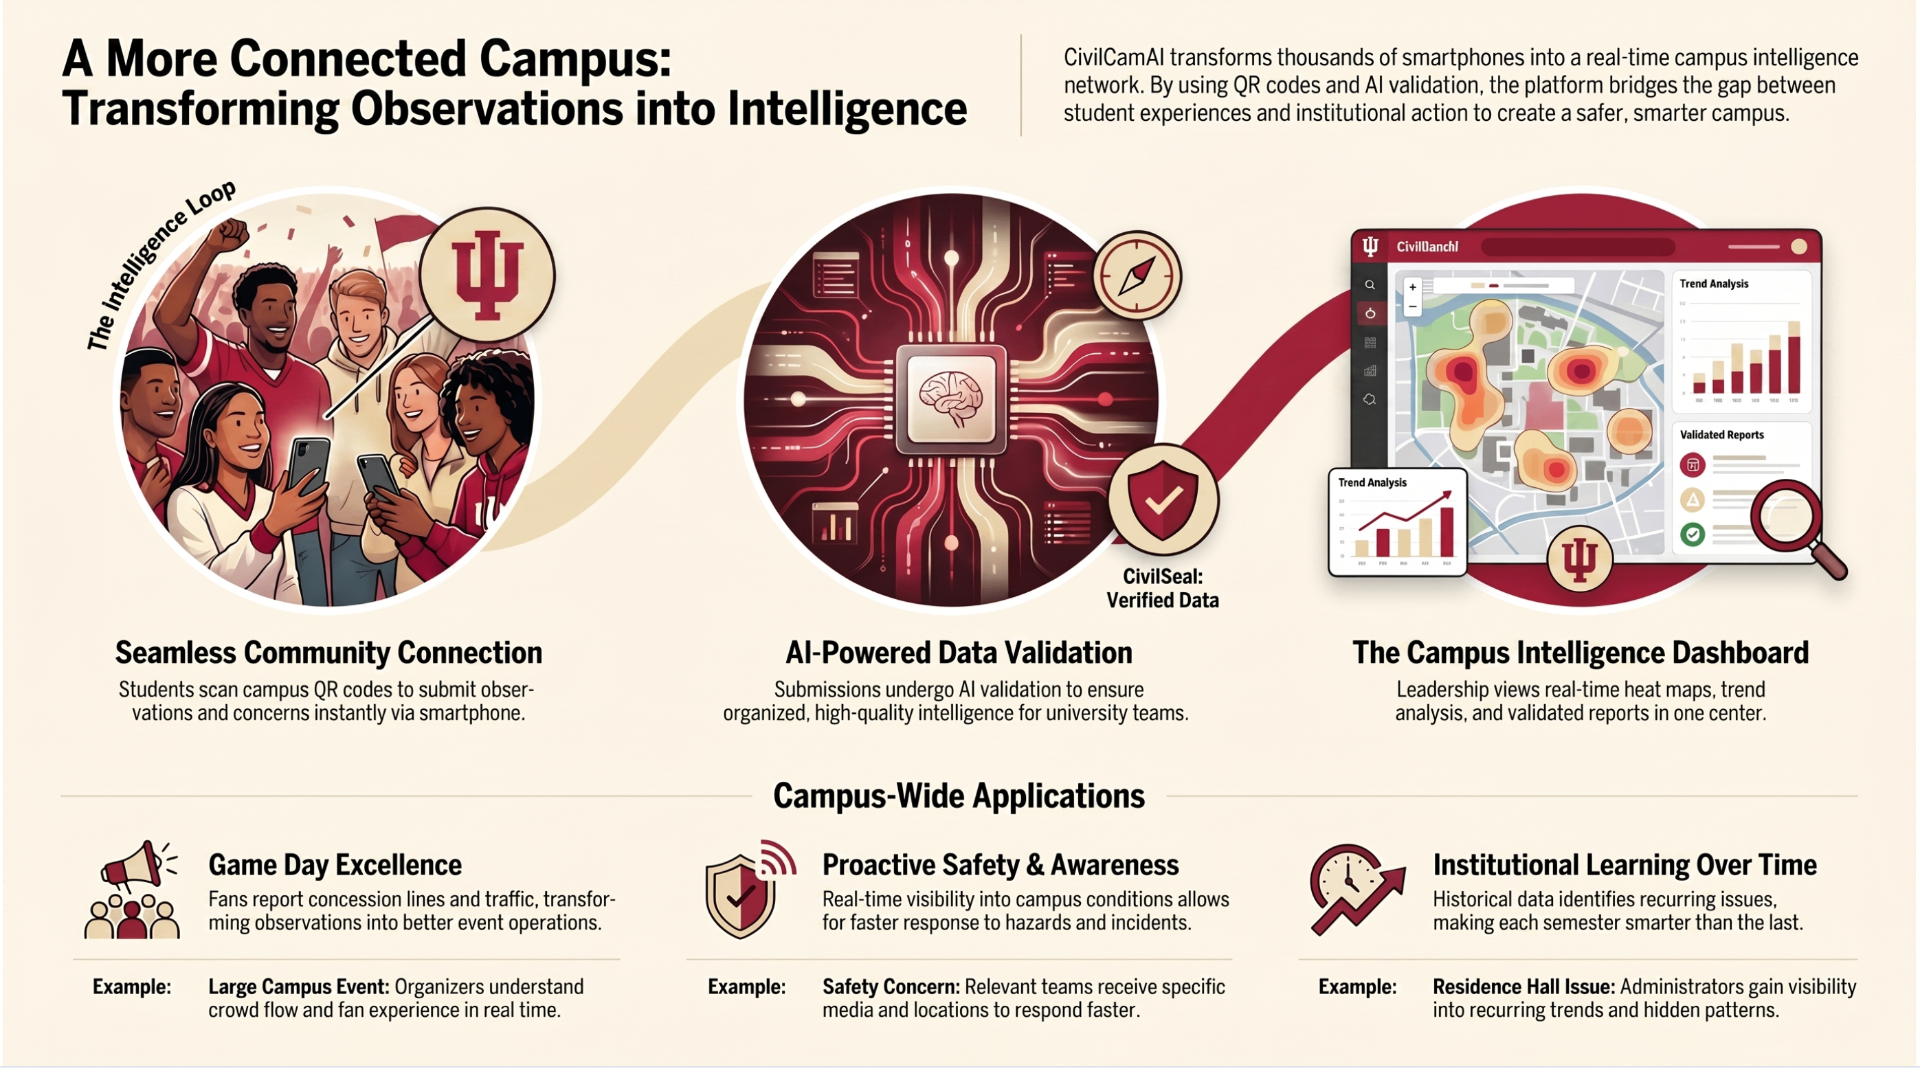
A More Connected Campus: Transforming Observations into Intelligence — infographic showing the CivilCamAI intelligence loop, AI-powered data validation, campus intelligence dashboard, and campus-wide applications for Indiana University
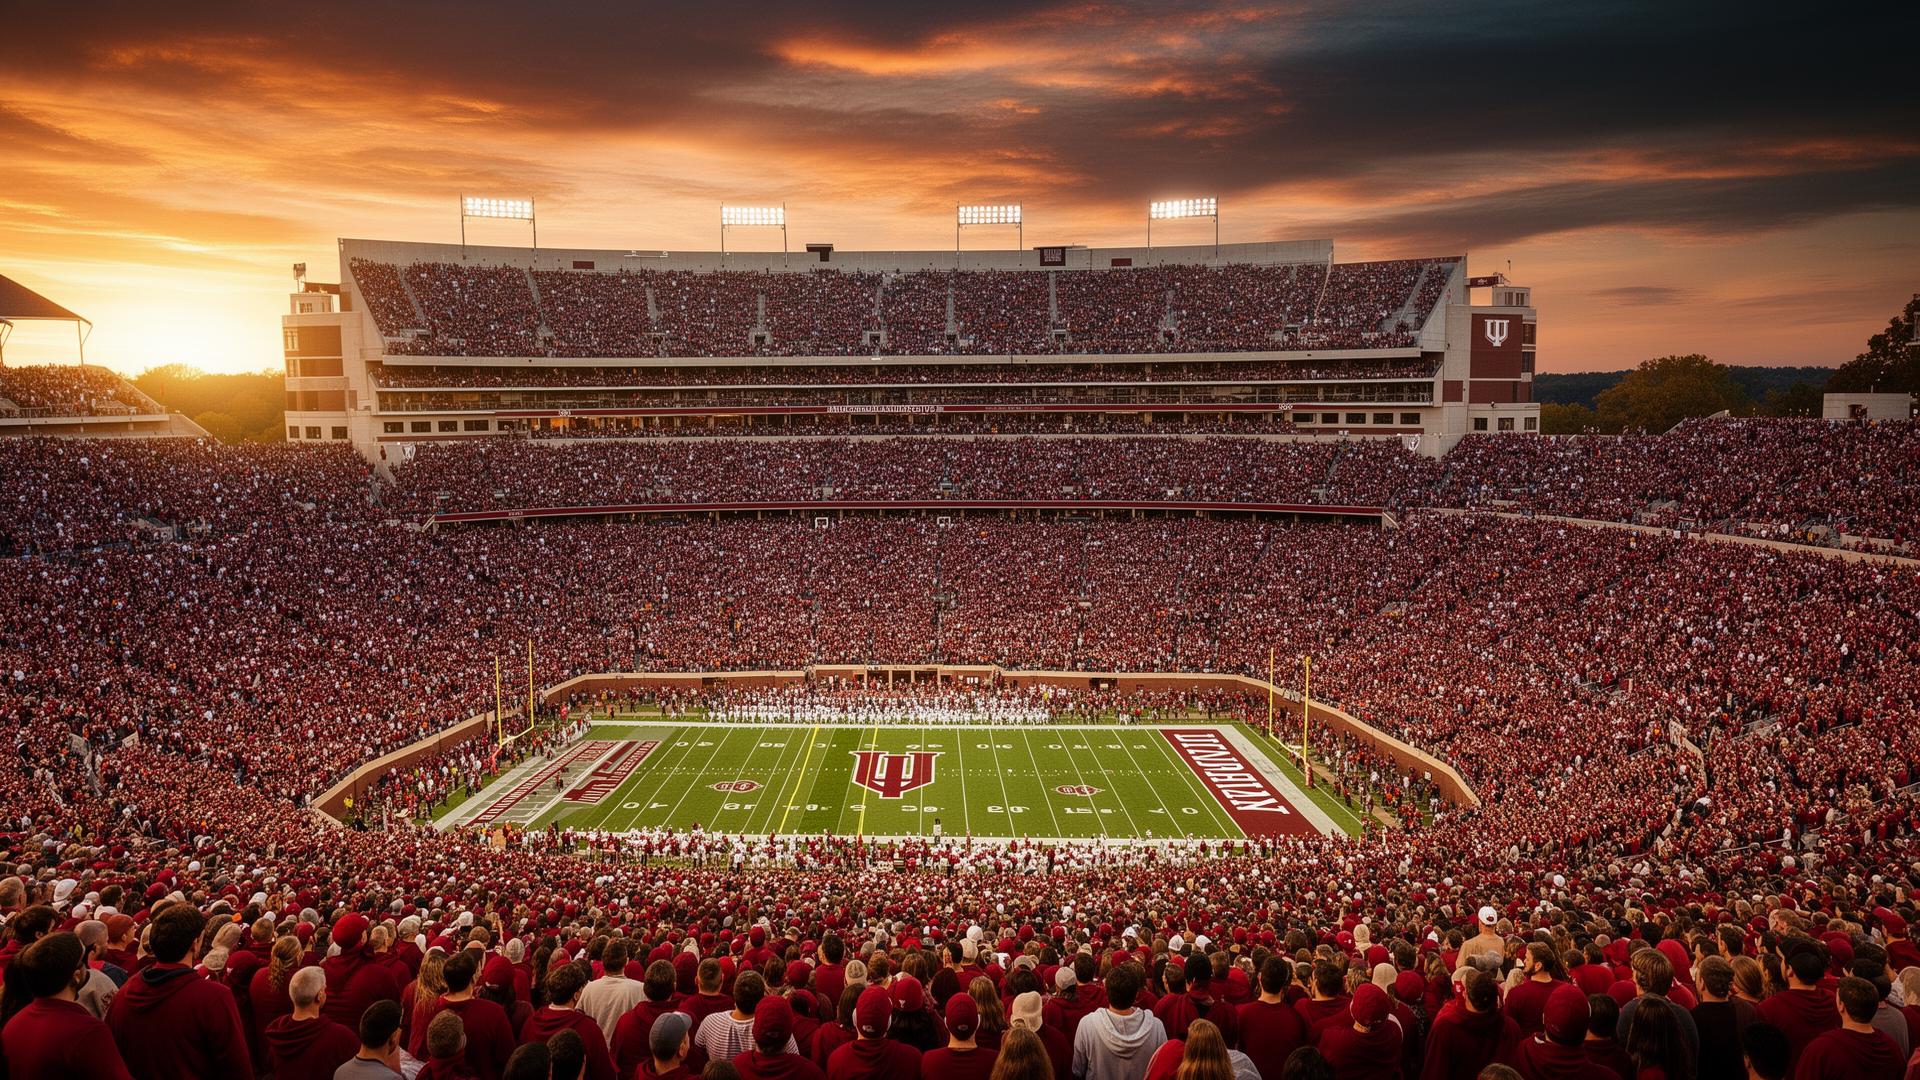
Indiana football stadium
Simulation · Game Day

Indiana Football Game Day

Indiana vs. Michigan · 78,000 fans
Without CivilCamAi

A disturbance begins in Section 114

  1. 1Fan records video on phone
  2. 2Posts clip to social media
  3. 3Security learns several minutes later
  4. 4Crowd around incident grows
  5. 5Issue escalates before response arrives
Time-to-awareness: ~9 min
With CivilCamAi

Same incident, validated in seconds

  1. 1Five attendees submit observations
  2. 2AI cross-validates location & content
  3. 3Geofence confirms event zone (Section 114)
  4. 4Command Center receives alert
  5. 5Security dispatched — incident resolved quickly
Time-to-awareness: ~2.8 min
52%
Faster Awareness
37%
Faster Response
28%
Reduction in Escalated Incidents

Simulation metrics for demonstration purposes only.
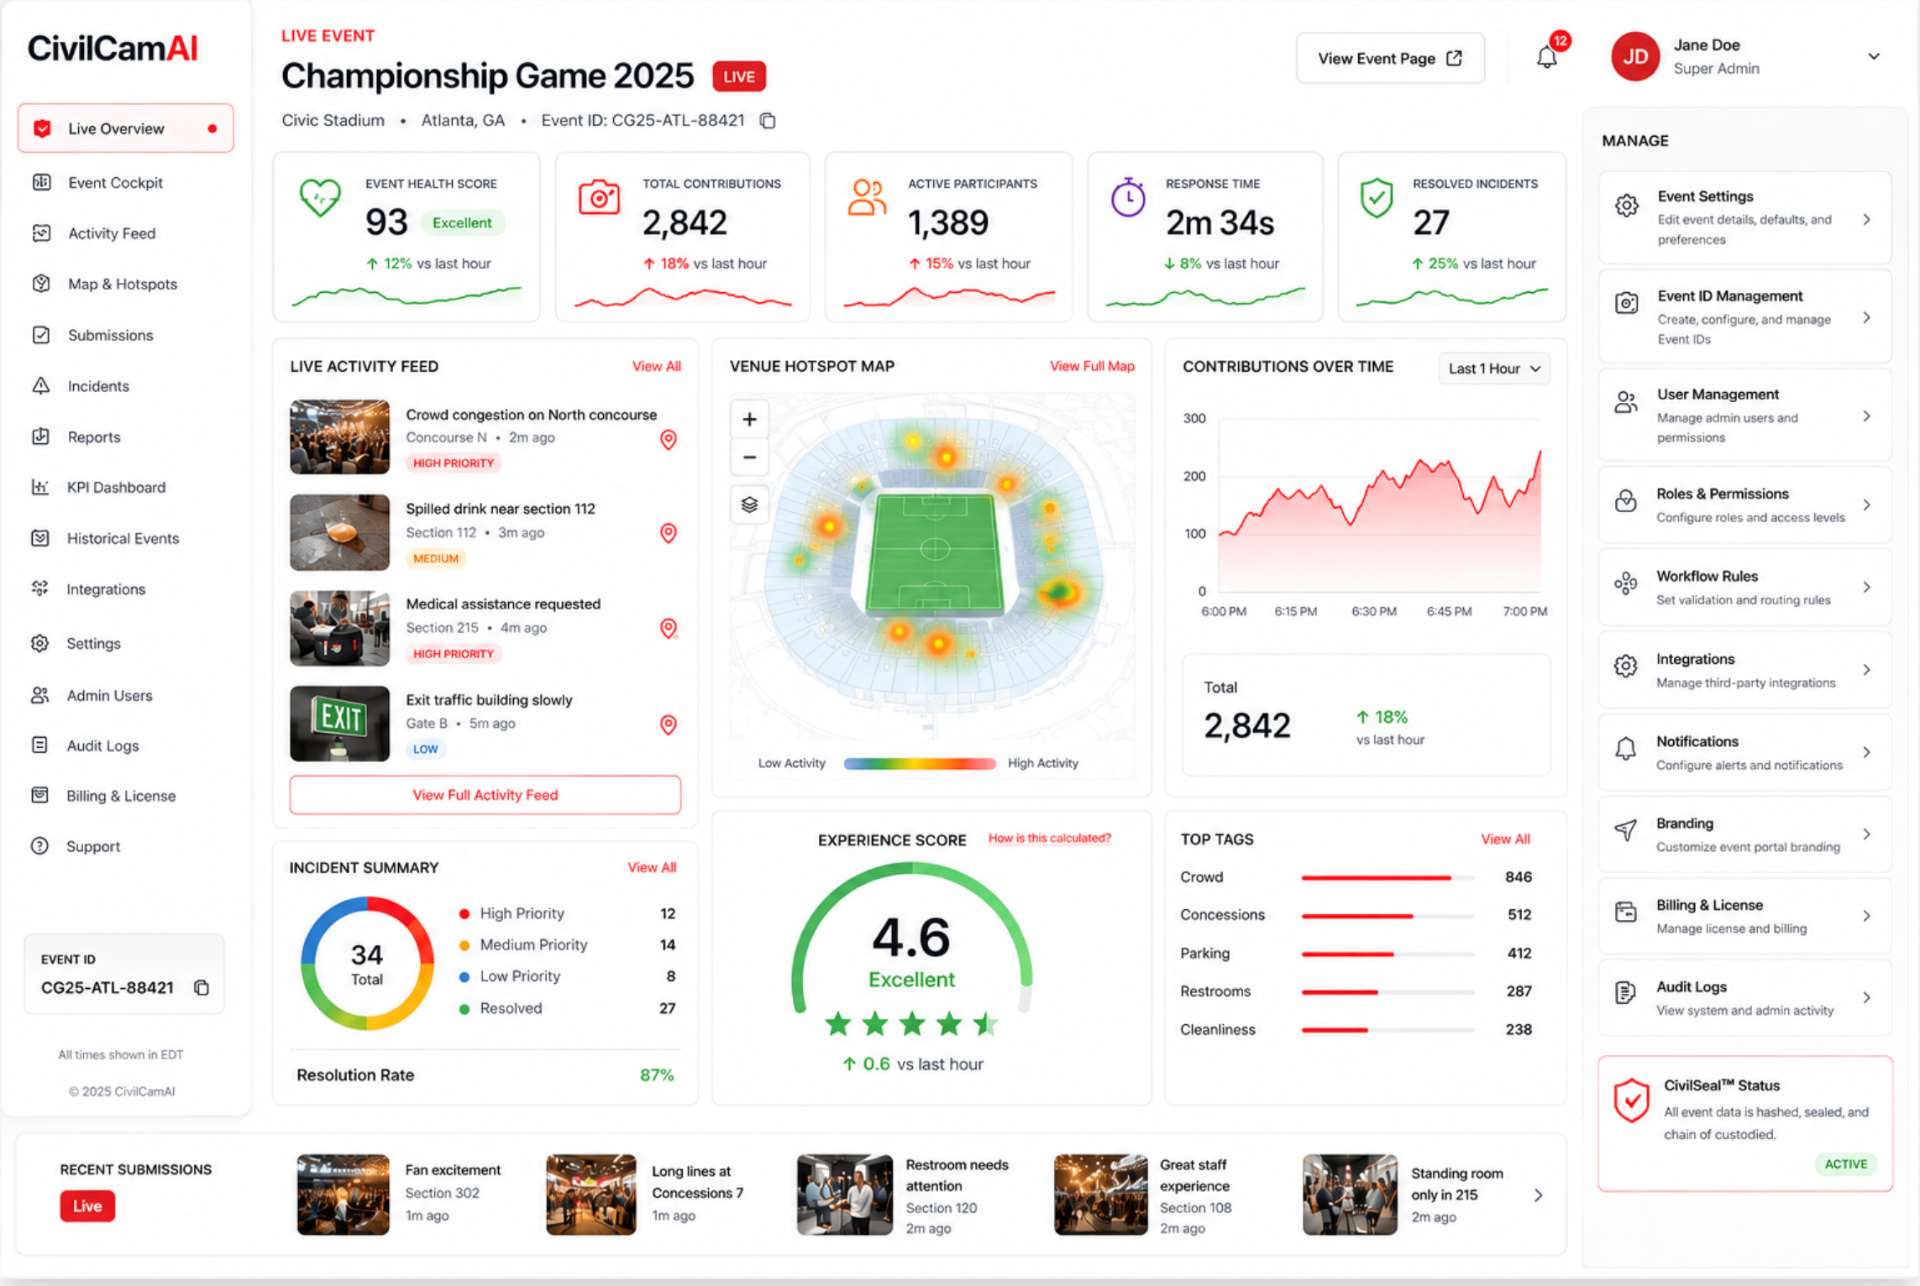
CivilCamAI live event dashboard showing real-time game day intelligence — event health score, active participants, venue hotspot map, incident summary, and experience score for a championship game

Dashboard visualization for demonstration purposes only.

Transportation & Campus Operations

The AI clusters reports before they become incidents.

Pattern Detection Example
17
reports · same intersection · same week
AI Insight
"Emerging hazard cluster at 17th & Jordan — broken lighting + ice. Recommend proactive facilities dispatch."
Broken lighting
Unsafe sidewalks
Ice hazards
Shuttle delays
Parking concerns
Suspicious activity
Indiana University Command Center™

One screen. Every signal across campus.

An enterprise-grade operations dashboard mockup built for university leadership, athletics operations, and campus safety teams.

IU · Live Operations
Saturday · 19:42 ET
All systems operational
Active Reports
212
+18 last hr
Validated Incidents
47
12 zones
Avg Awareness
2.8 min
↓ from 12.4
Fan Sentiment
88%
stadium-wide
Campus Heat Map
Last 60 min
Memorial Stadium · Sec 114 hotspot
Active Alerts
Live
19:41
Sec 114 disturbance — 5 reports
19:38
Gate D bottleneck
19:31
Wright Quad — water leak
19:22
Lot 17 lighting outage
19:14
17th & Jordan ice hazard
19:02
Shuttle B late · Briscoe
Residence Hall Alerts
  • Wright Quad · leak
  • Read Hall · noise
  • Briscoe · maintenance
Transportation Insights
  • Route B +6 min delay
  • Lot 17 — 92% full
  • Shuttle C on-time
Executive Summary
  • 52% faster awareness
  • 37% faster response
  • +14% fan sentiment

Visualization for demonstration purposes only.

Intelligence Compounding

Intelligence That Improves Every Semester

Semester 1
Baseline established
  • Pattern recognition
  • Initial heat maps
Semester 2
Operational rhythm
  • Repeat incident detection
  • Crowd behavior models
Semester 3
Predictive layer
  • Traffic analysis
  • Event optimization
Semester 4
Connected campus
  • Fan experience lift
  • Operational awareness

The more the community participates, the smarter the university becomes.

CivilSeal™ University Archive

Every event closes with a verified record.

Searchable, cryptographically sealed, executive-ready intelligence — preserved for the university's institutional memory.

  • Evidence Validation
  • Chain of Custody
  • Cryptographic Hashing
  • Executive Intelligence Report
  • CivilSeal Certification
CivilSeal Archive · IU
2025 — 2026
IU vs Michigan
Sep 14
Sealed · 412 validated reports
Hoosier Hysteria
Oct 24
Sealed · 188 validated reports
IU vs Purdue
Nov 27
Sealed · 367 validated reports
Spring Commencement
May 8
Sealed · 521 validated reports
Little 500 Race
Apr 18
Sealed · 244 validated reports
Simulated 12-Month Results

A hypothetical year of community intelligence.

Metric
Before
After
Student Reports
180
2,950
Validated Incidents
102
1,420
Average Awareness Time
12 min
2.8 min
Escalated Events
71
43
Fan Complaints
420
245
Student Satisfaction
74%
88%

All metrics shown are hypothetical simulation data created for demonstration purposes and do not represent actual Indiana University results.

Executive Summary

A More Connected Campus Experience

CivilCamAi transformed students, faculty, staff, and visitors into a connected awareness network. By reducing friction in reporting and increasing real-time visibility into campus conditions, the university gained a powerful new tool for improving safety, fan experiences, operations, and community engagement.
Simulated executive perspective
Potential Applications
Student Life
Athletics
Campus Operations
Residence Halls
Transportation
Graduation Events
Visitor Experience
Community Awareness

This page represents a simulated deployment scenario created for demonstration and educational purposes only. Indiana University is used as an illustrative example and is not currently represented as a customer, partner, or user of CivilCamAi.